and Data Visualization for a Financial Company

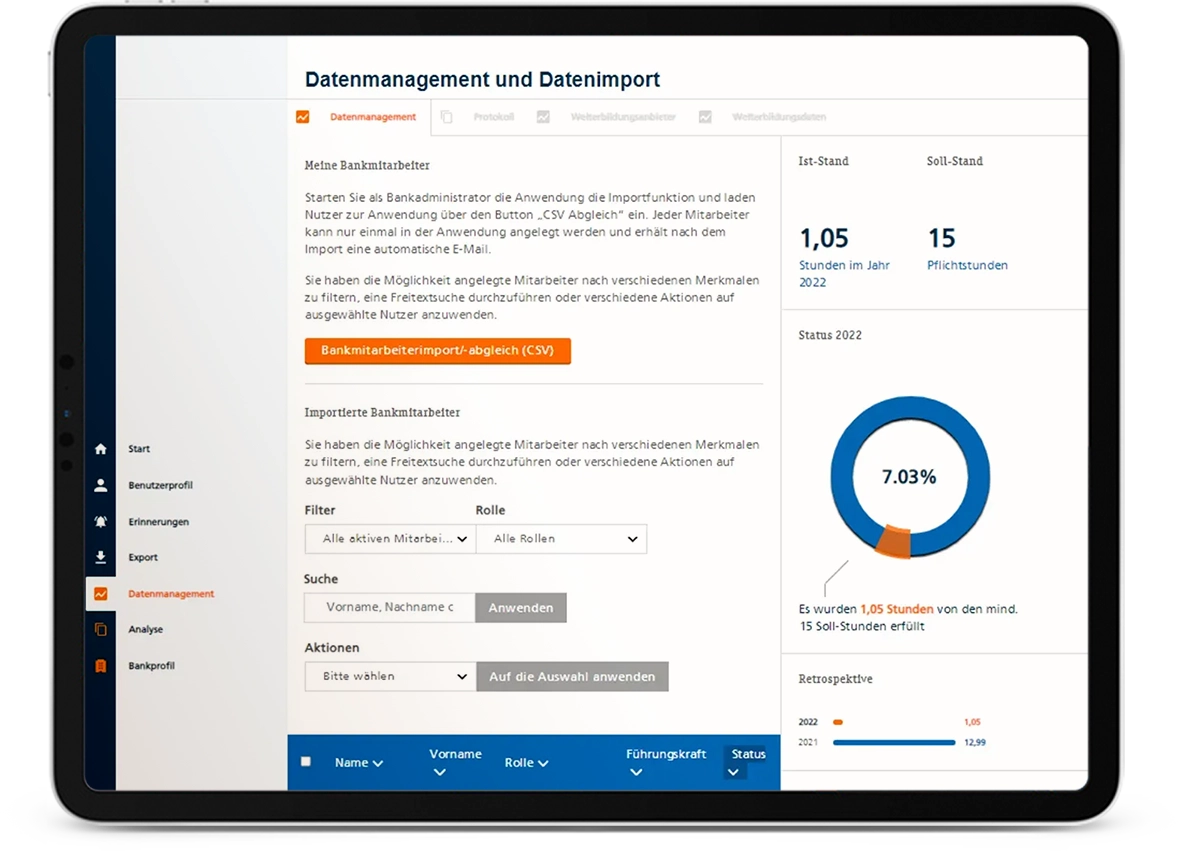
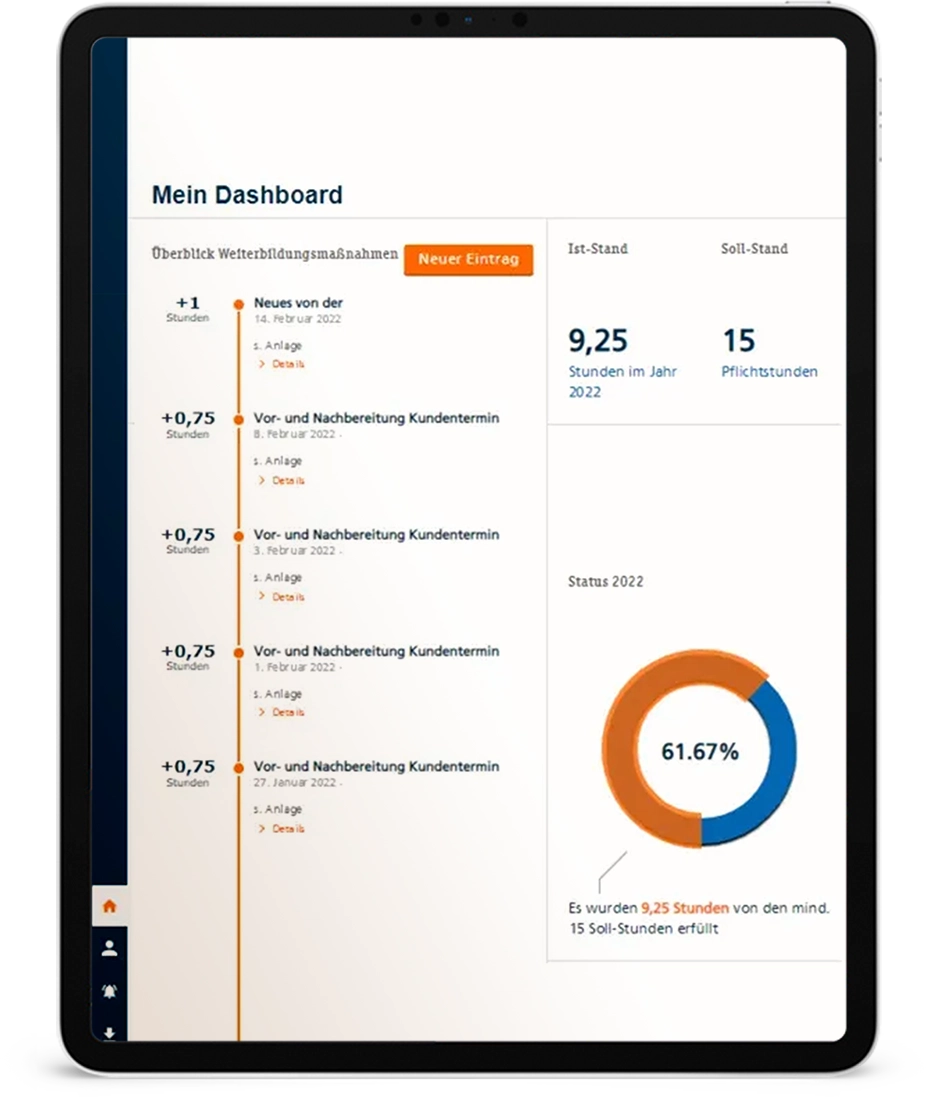
A financial company approached Attico International to create a web service that could track individual progress in professional training, monitor employee achievement and generate reports on employee participation in training events. We designed an API and integrate it with third-party services. Attico's solution involved using Drupal and implementing a complex roles and permissions system along with graphical data visualization.


The client's goal was to create a web service as a SaaS that would allow financial companies to track individual progress in professional training, monitor employee achievement of yearly targets, and create reports on employee participation in training events.

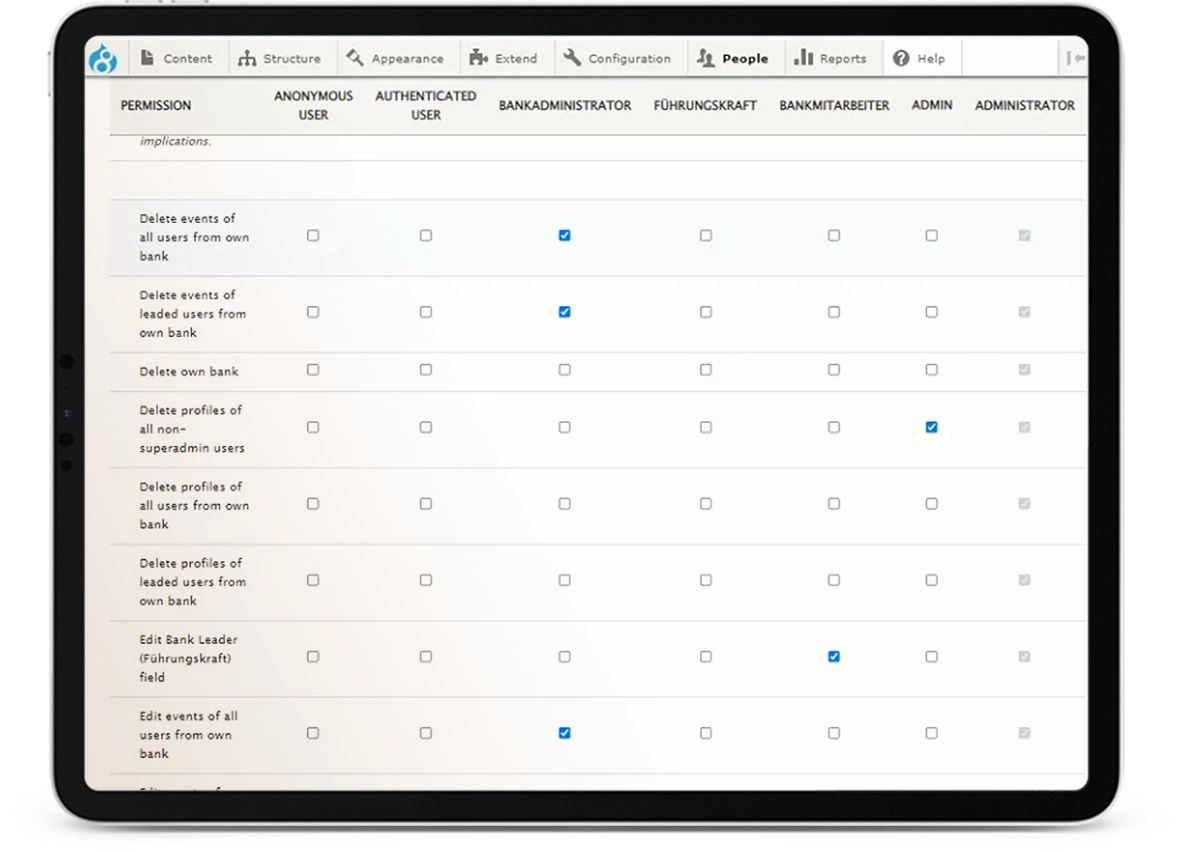
We developed a solution that used Drupal, a flexible content management system, to create a web service that met the client's requirements. Also, we implemented a custom module to handle the complex roles and permissions system, ensuring that users could access only the data they were authorized to view.

We used the views module to create reports with filtering and grouping options, and created custom modules to extend its functionality.

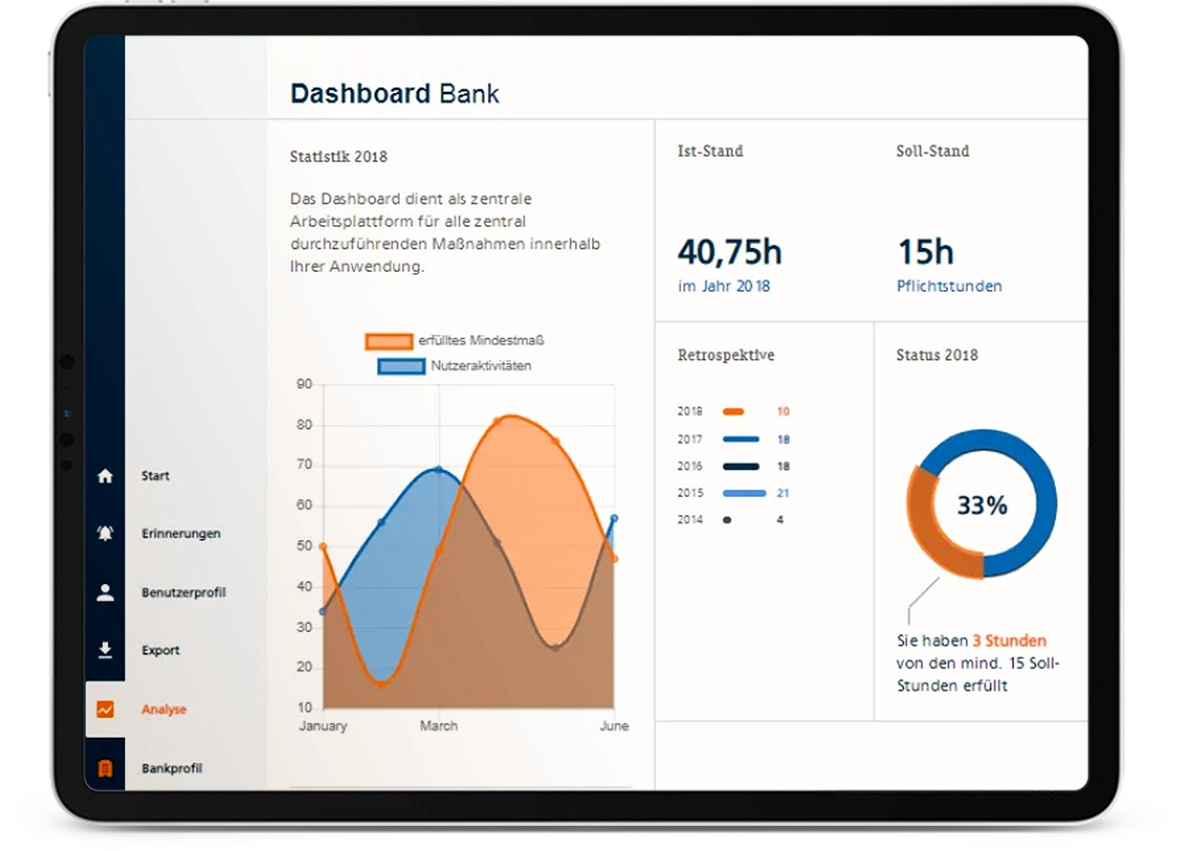
Finally, we used Chart.js, a JavaScript library, to create graphical data visualizations.

Attico International successfully delivered a web service that:
The client reported that over 600 financial organizations and 12,000 employees were registered on the site, demonstrating its success.